
Table of Contents
- Why Reporting Stays Broken Even After ERP Go-Live
- What Power BI + Business Central Actually Gives You
- How the Connection Works: A Non-Technical Overview
- The Three Dashboards Every Business Central Customer Should Build First
- Common Mistakes to Avoid
- How Gigatorb Approaches Power BI Implementation
- Que 1: Is Your Business Ready for This?
- Final Thought
- Que 2: Ready to Build Your Executive Dashboards?
Most businesses using Microsoft Dynamics 365 Business Central are sitting on a goldmine of operational data — and doing almost nothing with it.
Finance teams export to Excel. Operations managers wait for weekly reports. Leadership makes decisions based on last month's numbers. This is not a data problem. It is a visibility problem.
Microsoft Power BI, when properly connected to Business Central, eliminates that gap entirely. If you are still pulling numbers manually after go-live, our guide on real business problems solved by Business Central explains why disconnected reporting is so common — and costly.
Why Reporting Stays Broken Even After ERP Go-Live
After a Business Central implementation, companies often assume reporting will improve automatically. In reality, the ERP captures accurate data — but without a dedicated reporting layer, that data remains locked inside transaction screens.
Common complaints from finance and operations leaders six months post-go-live:
- “I still have to pull reports manually every Monday.”
- “We have the data but no one can read it quickly.”
- “Our leadership dashboard is still a spreadsheet.”
This is where Power BI changes the game. For a broader view of analytics and automation inside the platform, see the latest Business Central capabilities — including native Power BI integration.
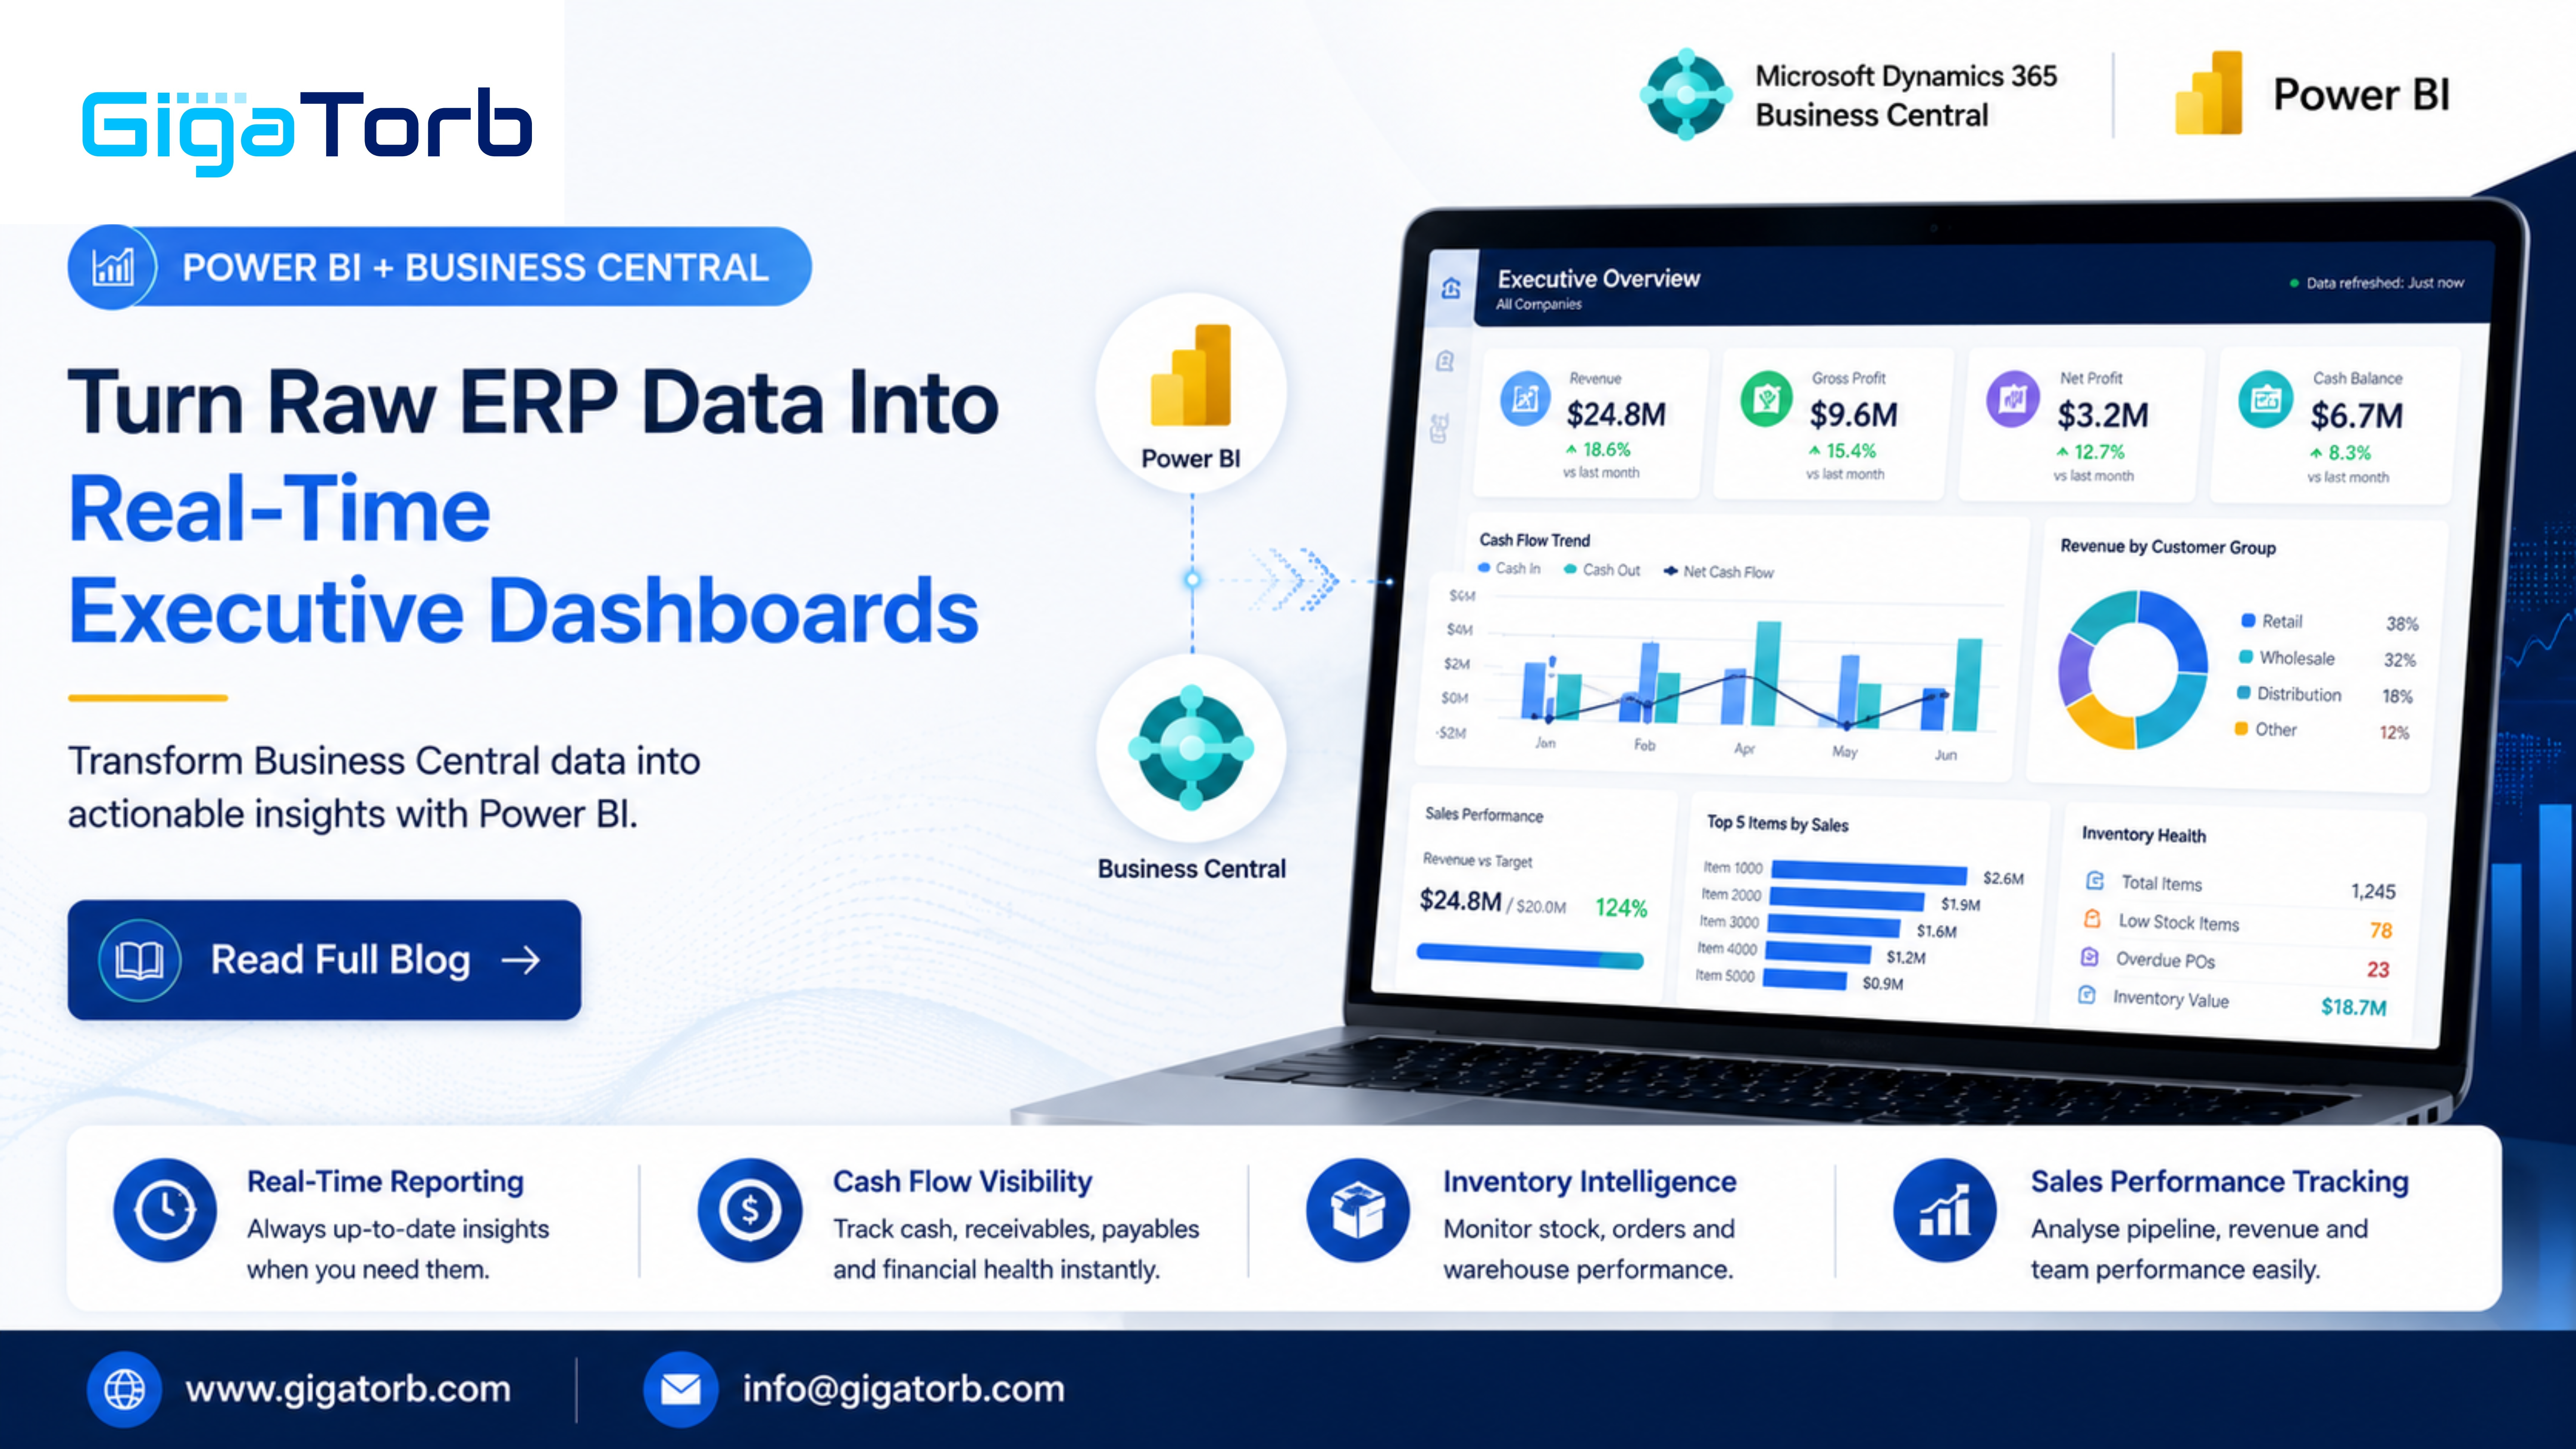
What Power BI + Business Central Actually Gives You
When you connect Power BI to Business Central using Microsoft's native connector, you get:
1. Live Financial Snapshots
See your P&L, cash position, accounts receivable aging, and budget vs. actuals — updated in real time, not at month-end.
2. Inventory and Supply Chain Visibility
Track stock levels, reorder alerts, vendor lead times, and inventory turnover ratios across warehouses without opening Business Central itself.
3. Sales Performance by Region, Rep, or Product
Build leaderboards, pipeline views, and conversion rate dashboards that sync directly from your BC sales orders and customer records.
4. Custom KPI Scorecards for Leadership
Design board-level dashboards that show only what matters — revenue, margin, outstanding payables, and headcount costs — with drill-down capability on demand.
Pairing dashboards with workflow automation — for example month-end task tracking — is covered in our Power Automate finance automation guide for Business Central.
How the Connection Works: A Non-Technical Overview
Microsoft provides a built-in Power BI connector for Business Central. Here is the basic flow:
- Connect: Use Power BI Desktop and select the Business Central connector. Authenticate with your Microsoft 365 credentials.
- Select APIs: Business Central exposes standard OData APIs for finance, inventory, purchases, sales, and more. You select which data entities to pull.
- Model: Power BI lets you build relationships between tables — for example, linking customers to invoices to payment history.
- Publish: Once your report is ready, publish it to Power BI Service. Your team accesses it from any browser or the Power BI mobile app.
- Embed (optional): Reports can be embedded directly inside Business Central pages using the built-in Power BI embed feature, so users never have to leave their ERP.
No third-party tool. No data exports. No manual refresh cycles.
The Three Dashboards Every Business Central Customer Should Build First
Dashboard 1: CFO Cash Flow View
- Cash balance today vs. 30 / 60 / 90 days projected
- Overdue receivables by customer
- Upcoming payables and due dates
- Burn rate vs. budget
Dashboard 2: Operations Inventory Health
- Items below reorder point
- Slow-moving stock (no movement in 60+ days)
- Purchase order status and expected delivery dates
- Warehouse utilisation by location
Dashboard 3: Sales Pipeline and Revenue Tracker
- Open quotes and their conversion probability
- Revenue booked vs. target by month
- Top 10 customers by revenue
- Sales rep activity and close rate
Common Mistakes to Avoid
Mistake 1: Pulling Too Much Data at Once
Start with two or three Business Central APIs. Pulling every available entity slows refresh times and overwhelms new users.
Mistake 2: Skipping Data Validation
Before you build a dashboard, verify that your Business Central data is clean. Dashboards amplify both good data and bad data. An inventory dashboard built on uncategorised items is worse than no dashboard.
Mistake 3: Building for Yourself, Not the Audience
A CFO dashboard should have five numbers, not fifty. Design for the person who will read it, not the person who built it.
Mistake 4: Forgetting Row-Level Security
If your Power BI reports contain sensitive financial or HR data, configure row-level security so each user only sees what they are authorised to see.
How Gigatorb Approaches Power BI Implementation
At Gigatorb, we treat reporting as part of the ERP implementation, not an afterthought. Our approach:
- We identify the three to five decisions each stakeholder makes every week
- We map those decisions to the data that already exists in Business Central
- We build focused dashboards, not data dumps
- We train users to read and act on their dashboards, not just admire them
The result is a reporting layer that actually gets used — and that drives faster, better decisions from day one. If you are evaluating ERP for the first time, Business Central as a smart ERP in 2026 and why growing businesses need Business Central are useful starting points for planning reporting from day one.
Que 1: Is Your Business Ready for This?
You are ready to connect Power BI to Business Central if:
- Your Business Central data has been live for at least three months
- Your chart of accounts and item categories are properly structured
- You have a Microsoft 365 Business or Enterprise licence (Power BI Pro is included in many plans)
- You have at least one person — in finance, operations, or IT — who will own the dashboards going forward
If you are still mid-implementation, this is the right time to start planning your reporting architecture before go-live, not after.
Final Thought
Business Central gives you accurate, real-time operational data. Power BI gives your leadership team the ability to see and act on that data without waiting for a report. Together, they turn your ERP from a transaction system into a genuine decision-making engine.
If your reports are still living in spreadsheets, that is the problem worth solving next.
Que 2: Ready to Build Your Executive Dashboards?
Gigatorb helps Business Central customers design, connect, and deploy Power BI dashboards that leadership actually uses — from CFO cash flow views to operations and sales scorecards.
- Email: info@gigatorb.com
- Phone: +91 98933 39105
- Website: www.gigatorb.com
- Book a consultation: gigatorb.com/consultation
Business Central services · Power Platform services · Contact Gigatorb
Tags: Power BI · Business Central · Executive dashboards · ERP reporting · Power Platform · Real-time analytics · CFO dashboards · Microsoft 365
Ready to Transform Your ERP?
Connect with Gigatorb Software Pvt Ltd for a free consultation.
Book a Free Consultation